Using Firefox Developer Tools

learn how to use Devtools to explore websites

Introduction

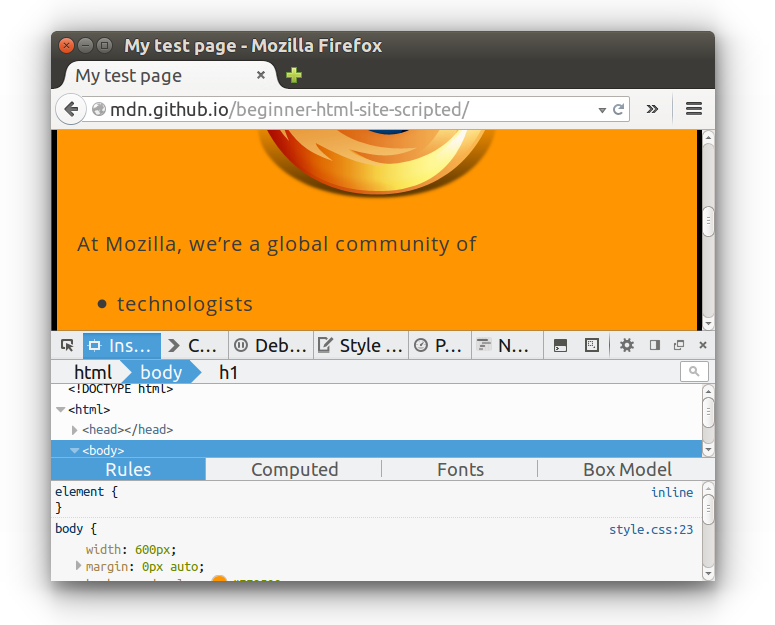
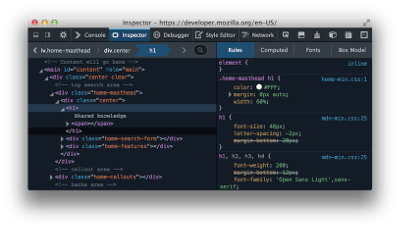
Every modern web browser includes a powerful suite of developer tools. These tools do a range of things, from inspecting currently-loaded HTML, CSS and JavaScript to showing which assets the page has requested and how long they took to load.

Your Mission: Examine, edit, and debug HTML, CSS, and JavaScript using the DevTools. Are you ready?

Getting ready

How to open the devtools in your browser

Now your Club is fired up and ready to go, it's time to learn how we can start using devtools!

The devtools live inside your browser in a subwindow that looks roughly like this:

Devtools

How do you pull it up?

  • Keyboard. Ctrl + Shift + I
  • Context menu. Press-and-hold/right-click an item on a webpage (Ctrl-click on the Mac), and choose Inspect Element from the context menu that appears. (An added bonus: this method straight-away highlights the code of the element you right-clicked.)

Start exploring!

Fork our Repo Students

For going through the activity, students have to fork our GitHub repository to explore our examples. This requires you to be familiar with the tool Git and the GitHub ecosystem. In the Campus Clubs learning activities you can find two activities for mastering Git and learning how to contribute to Open Source on GitHub.


Fork

Example 1 - DOM inspector and the CSS editor

In the example 1 we will learn about the DOM inspector and the CSS editor. This tool allows you to see what the HTML on your page looks like at runtime, as well as what CSS is applied to each element on the page. It also allows you to instantly modify the HTML and CSS and see the results of your changes reflected live in the browser viewport.

Example 2 - JavaScript console

In the example 2 we will learn about the Javascript console. The JavaScript console is an incredibly useful tool for debugging JavaScript that isn't working as expected. It allows you to run lines of JavaScript against the page currently loaded in the browser, and reports the errors encountered as the browser tries to execute your code. To access the console, just press the Console button.

Example 3 - JavaScript Debugger

In the example 3 we will learn about the JavaScript Debugger. The JavaScript Debugger enables you to step through JavaScript code and examine or modify its state to help track down bugs. You can use it to debug code running locally in Firefox or running remotely, for example on an Android device running Firefox for Android.

Example 4 - Network monitor

In the example 4 we will learn about the Network monitor. The Network Monitor shows you all the network requests Firefox makes (for example, when it loads a page, or due to XMLHttpRequests), how long each request takes, and details of each request.

Example 5 - Responsive Design Mode

In the example 5 we will learn about the Responsive Design Mode. Responsive design is the practice of designing a website so it looks and works properly on a range of different devices: in particular, mobile phones and tablets as well as desktops and laptops.

The most obvious factor here is screen size, but there are other factors as well, including the pixel density of the display and whether it supports touch. Responsive Design Mode gives you a simple way to simulate these factors, to test how your website will look and behave on different devices.

Congratulations and next steps

Congratulations! You just learned how use devtools to interact with a website.

Now you are able to use Devtools to inspect a site, view and edit page content and layout (CSS and HTML), see messages logged by a web page and interact with the page using JavaScript and discover how your website or app will look and behave on different devices and network types.

Next steps: Do you want do more? Try to build some nice examples of how to use devtools and send to us! Open a pull request in this activity repo with your own examples and we can share with other students!